Building an MCP Server for ODS Environment Management: AI-Powered DevOps
Building an MCP Server for ODS Environment Management: AI-Powered DevOps
Managing distributed database environments is tedious. You SSH into a server, run dsetool status, parse the output, check Spark jobs, tail logs, cross-reference refresh tables, all manually. Multiply that by 6 environments and you're spending hours on routine checks.
I built an MCP server that lets AI agents do all of this through natural language conversation.
The Problem
Our ODS (Operational Data Store) platform runs DSE (DataStax Enterprise) clusters with Spark analytics across 6 non-production environments. Daily operations involve:
- Checking if all 36 Spark jobs are running
- Monitoring DSE cluster health (nodetool status)
- Analyzing system.log for errors
- Tracking data refresh status from source systems
- Querying Astra DB tables for data validation
- Restarting failed jobs
Each task requires SSH access, knowledge of the right commands, and expertise to interpret the output. New team members take weeks to become proficient.
The Solution: MCP + AI Agents
The Model Context Protocol (MCP) is an open standard that lets AI assistants call external tools. Instead of building a custom chatbot, I built an MCP server that exposes our environment operations as tools. Any MCP-compatible AI agent (GitHub Copilot, Kiro, Amazon Q) can use them immediately.
Architecture
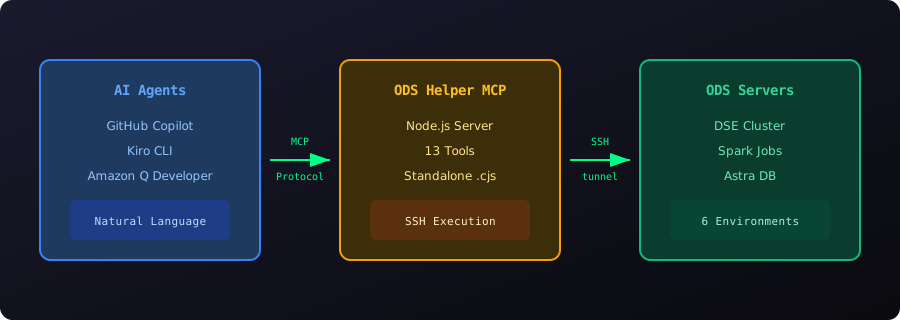
The system has three layers:
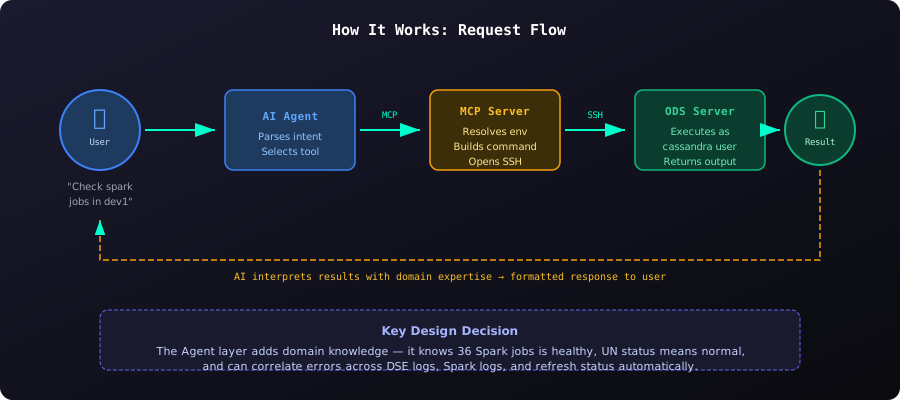
1. AI Agent Layer - The user's IDE-integrated AI (Copilot, Kiro CLI, etc.) receives natural language requests and decides which MCP tool to call.
2. MCP Server - A standalone Node.js process (ods-helper-mcp.cjs) that:
- Receives tool calls via the MCP protocol (stdio transport)
- Resolves environment names to hostnames
- Opens SSH connections to target servers
- Executes commands as the
cassandraservice user - Returns structured output to the agent
3. ODS Servers - The actual DSE/Spark infrastructure across 6 environments (dev, dev2, sit, uat, uat2, perf).
Available Tools
The MCP server exposes 13 tools covering the full operational surface:
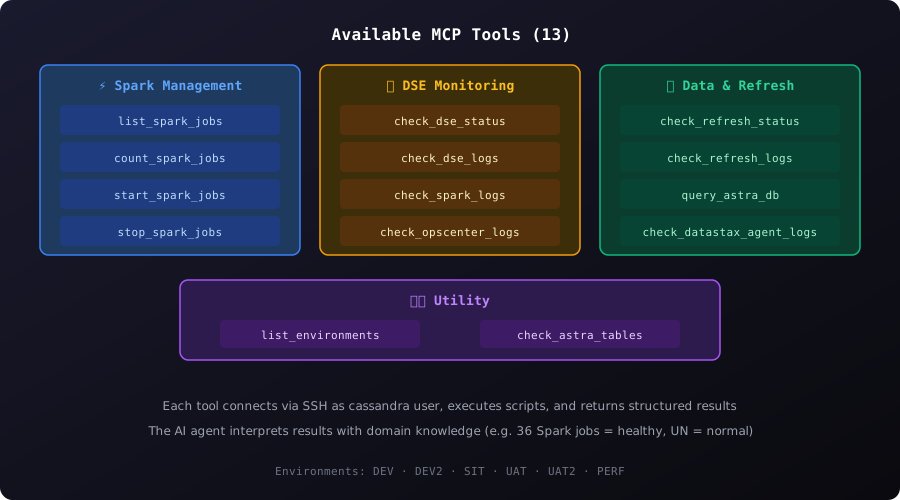
| Category | Tools | Purpose |
|---|---|---|
| Spark Management | list_spark_jobs, count_spark_jobs, start_spark_jobs, stop_spark_jobs | Full lifecycle control of the 36 Spark analytics jobs |
| DSE Monitoring | check_dse_status, check_dse_logs, check_spark_logs, check_opscenter_logs | Cluster health, error detection, log analysis |
| Data & Refresh | check_refresh_status, check_refresh_logs, query_astra_db, check_datastax_agent_logs | Data pipeline monitoring and validation |
| Utility | list_environments, check_astra_tables | Discovery and exploration |
Key Design Decisions
Standalone Executable
The server is bundled as a single .cjs file with no npm install required. Users just need Node.js 18+ and the file. This eliminates dependency hell and makes distribution trivial (drop a file, edit a JSON config, restart IDE).
Agent Layer for Domain Knowledge
The MCP server returns raw data. The agent layer adds interpretation:
- 36 running Spark jobs = healthy (fewer means something crashed)
UNin nodetool status = Up/Normal (not an error)- Correlating errors across DSE logs, Spark logs, and refresh status
This separation means the server stays simple while the AI provides intelligent analysis.
SSH as Transport
Rather than building REST APIs or installing agents on every server, the MCP server uses SSH, the same access path engineers already use. No infrastructure changes needed. The server authenticates with the user's corporate credentials passed via environment variables.
Environment Abstraction
Users say "check dev" instead of remembering hostnames like dse-node-03.internal.corp. The server maintains the environment-to-host mapping internally.
Implementation Highlights
MCP Tool Definition
Each tool is defined with a schema that tells the AI agent what parameters it accepts:
{
  name: "list_spark_jobs",
  description: "List running Spark jobs with details (job name, status, uptime)",
  inputSchema: {
    type: "object",
    properties: {
      environment: {
        type: "string",
        enum: ["dev", "dev2", "sit", "uat", "uat2", "perf"],
        description: "Target ODS environment"
      }
    },
    required: ["environment"]
  }
}
SSH Execution Pattern
Every tool follows the same pattern: resolve environment → open SSH → execute as cassandra → parse output → return structured result.
async function executeOnEnvironment(env, command) {
  const host = resolveHost(env); // e.g. "dev" → "dse-node-03.internal.corp"
  const conn = await sshConnect(host, process.env.ODS_SSH_USERNAME, process.env.ODS_SSH_PASSWORD);
  const output = await conn.exec(sudo -u cassandra ${command});
  conn.close();
  return output;
}
Production Safety
Production environments are deliberately disabled in the tool. The enum for environment only includes non-prod. This is a hard guardrail: even if someone asks the AI to "check prod", the tool physically cannot connect there.
Usage Examples
Once installed, you just talk to your AI assistant:
> "List spark jobs in dev"
→ Shows all 36 jobs with name, status, and uptime> "Check DSE status in uat"
→ Runs nodetool status, analyzes cluster health
> "Show refresh status for sit"
→ Queries refresh tracking table, highlights failures
> "Check and analyze spark logs in dev2 for errors"
→ Tails recent logs, identifies error patterns
> "Restart spark jobs in sit"
→ Stops all jobs, waits, starts all 36 jobs
The AI agent interprets the raw output with domain knowledge. It knows what "healthy" looks like and highlights anomalies.
Results
Since deploying this tool to the team:
- Environment checks went from 5-10 minutes of SSH + manual parsing to a single sentence
- New team members can operate environments on day one without memorizing commands
- Incident response is faster. Ask "what's wrong with dev?" and get a correlated analysis across all subsystems
- Knowledge is embedded in the agent, not locked in senior engineers' heads
What's Next
- Adding more tools for schema management and data validation
- Exploring read-only production access with additional approval gates
- Building a dashboard that aggregates health across all environments
- Contributing the MCP server pattern back as a template for other teams
Takeaway
MCP is a powerful pattern for DevOps automation. Instead of building custom UIs or chatbots, you expose operations as tools and let existing AI agents handle the UX. The server stays simple, the agent provides intelligence, and users get natural language access to complex infrastructure.
The full tool is available internally as a single-file download: no dependencies, no deployment pipeline, just a Node.js script and a config file.