Building a Personal Market Radar: Live Stock Analysis Powered by a 5-Scenario Framework
Building a Personal Market Radar: Live Stock Analysis Powered by a 5-Scenario Framework
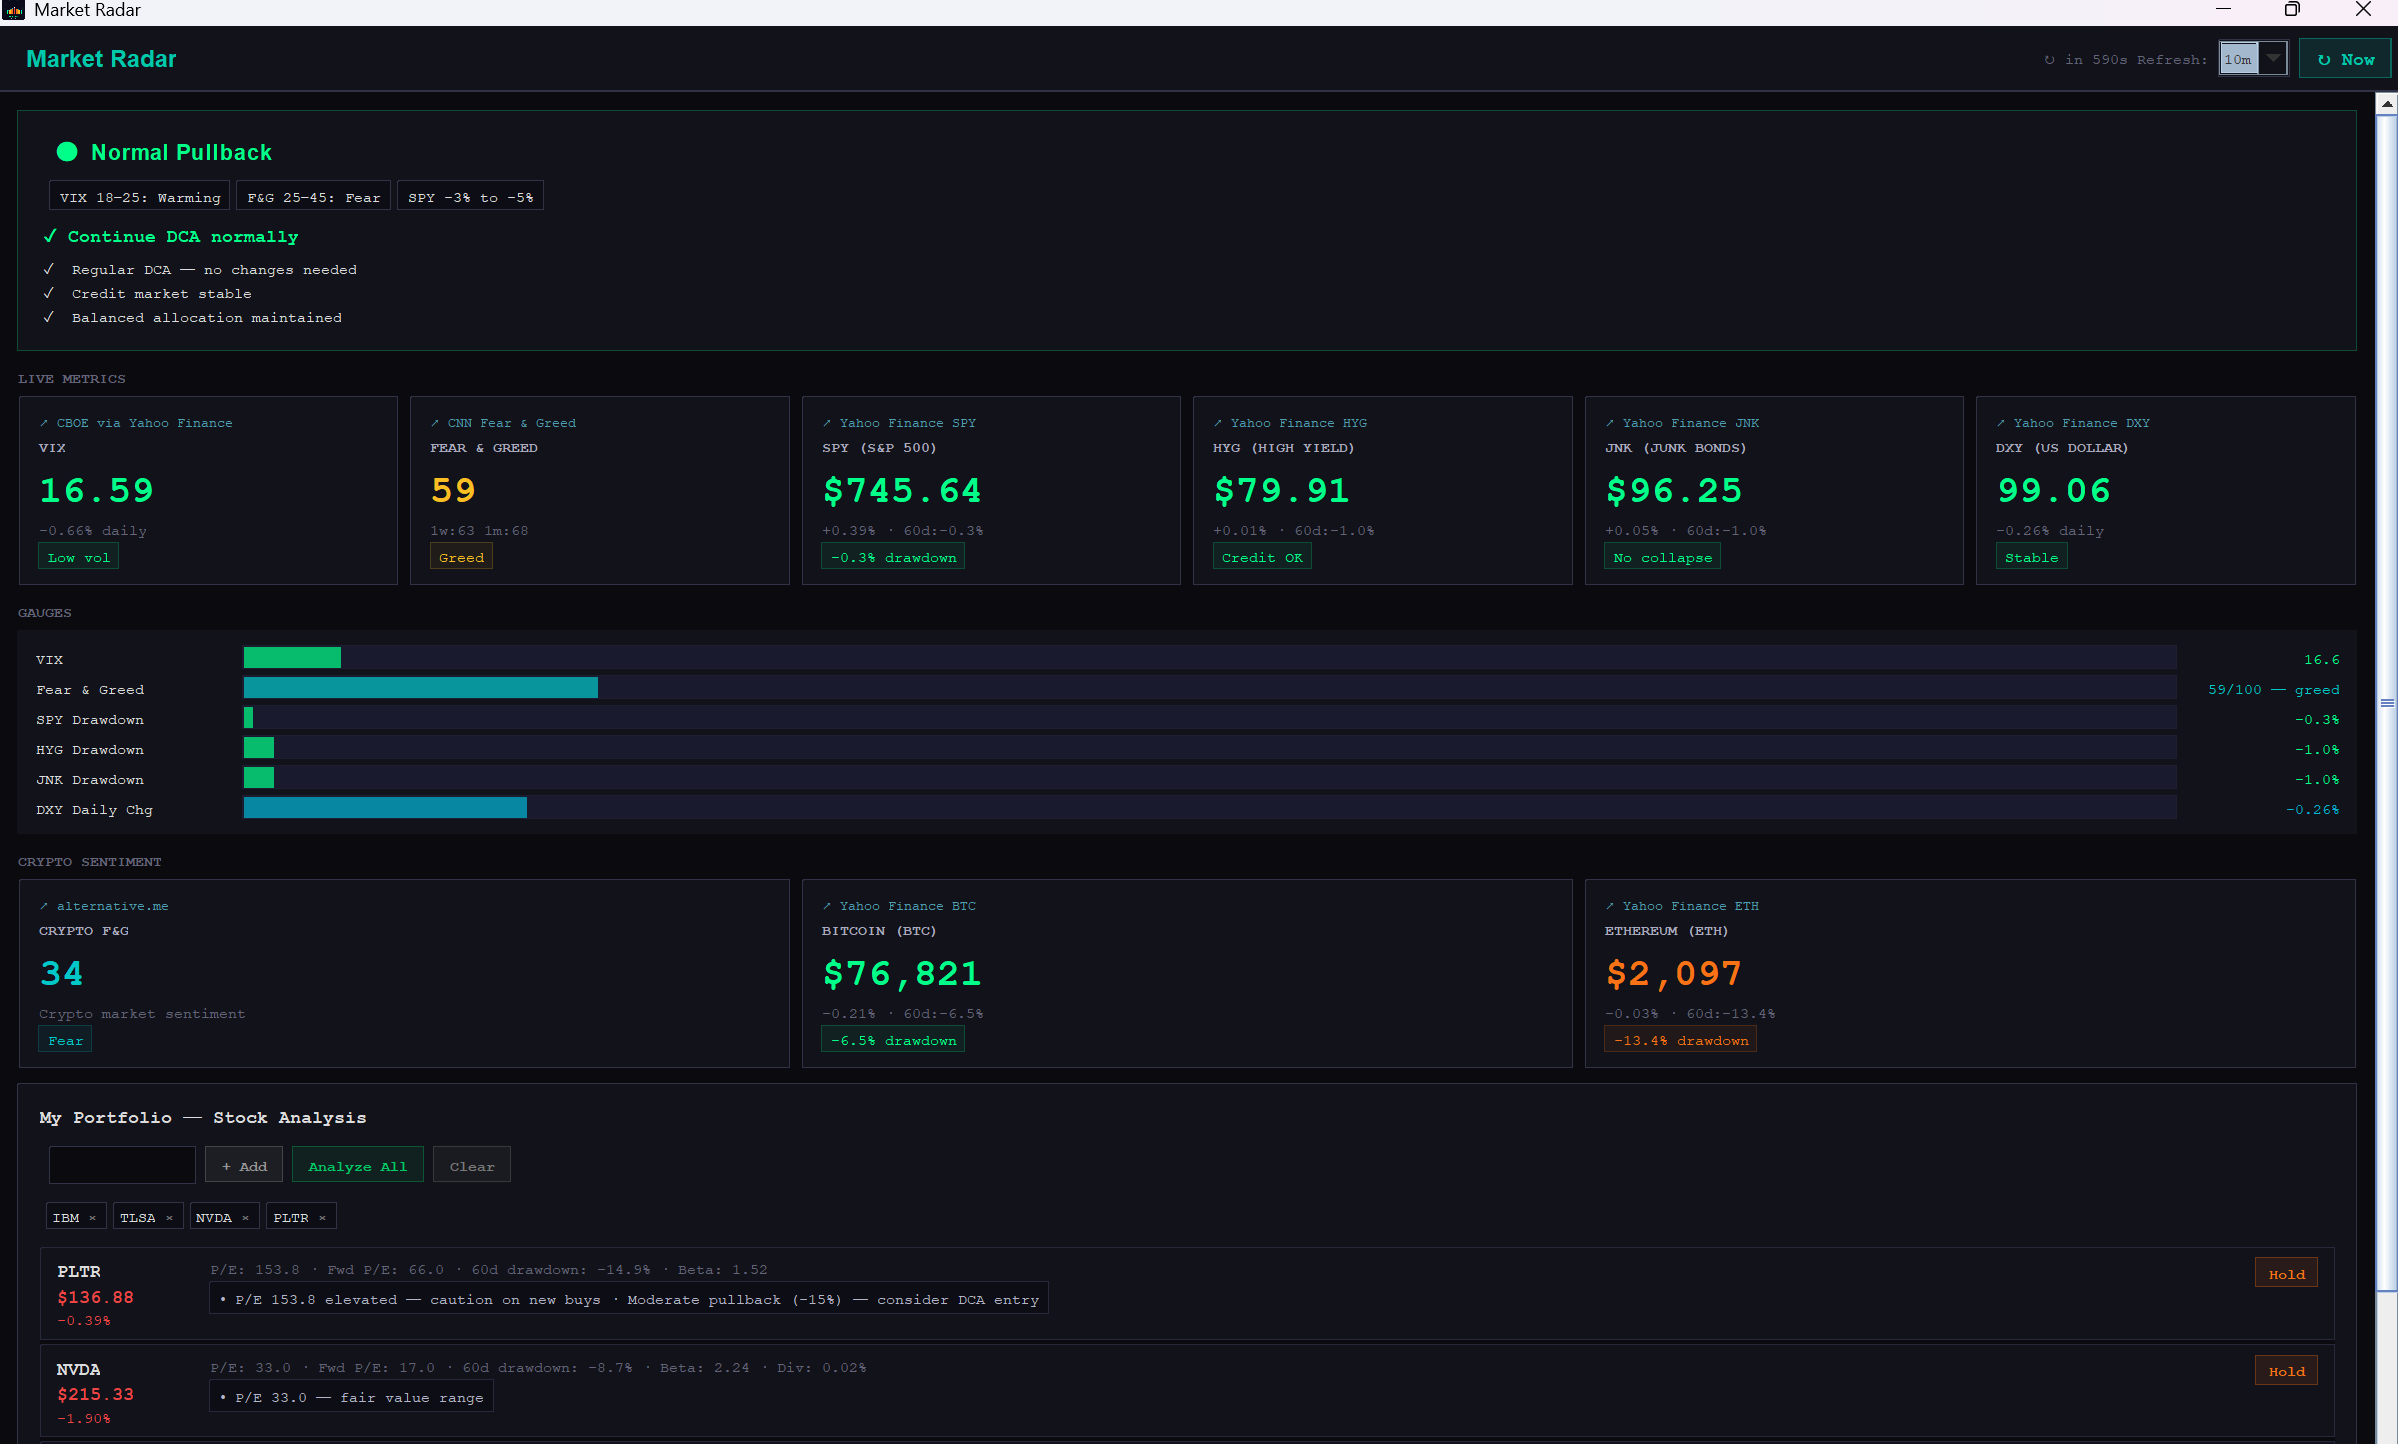
Most retail investors face the same problem: they see a market drop and don't know whether to buy more, hold steady, or get out. The answer depends on context - and context requires tracking multiple signals simultaneously. I built a private dashboard that does exactly that.
The Knowledge Framework
The dashboard is based on a 5-scenario classification system I developed from studying market behaviour across different volatility regimes. Each scenario maps to a specific combination of indicators and prescribes a different investment action.
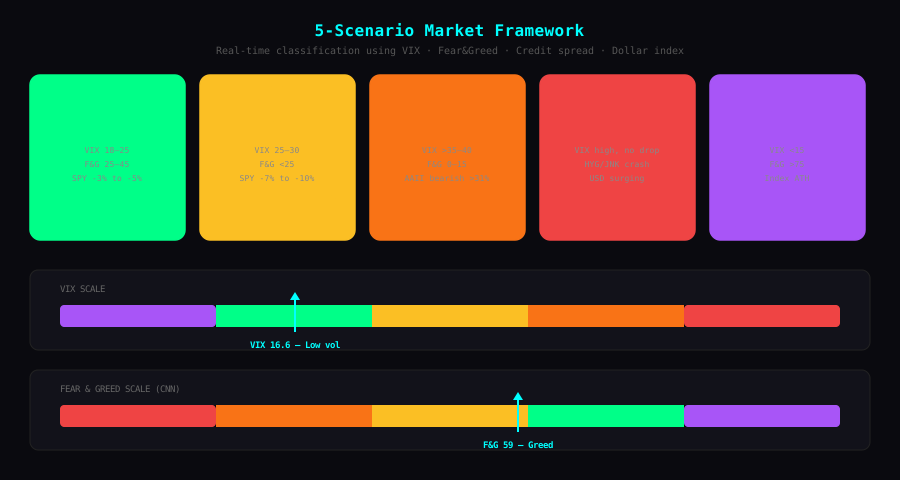
The key insight is that market conditions aren't binary (crash vs not-crash). They exist on a spectrum, and your response should be calibrated accordingly:
Scenario 1 - Normal Pullback: VIX 18–25, Fear & Greed 25–45, SPY down 3–5%. This is routine noise. Continue your regular DCA schedule without changes.
Scenario 2 - Fear Pullback: VIX approaching 30, extreme fear sentiment, SPY down 7–10% but high-yield bonds (HYG/JNK) are NOT collapsing. This is a buying opportunity - but deploy capital in three tranches (30% / 30% / 40%) at different VIX levels rather than all at once.
Scenario 3 - Extreme Fear: VIX above 35, Fear & Greed in single digits, AAII bearish sentiment above 31% (historically extreme). Credit markets and banking system still functioning normally. Counterintuitive as it feels, this is historically the best time to buy quality assets - but don't go all-in.
Scenario 4 - Systemic Risk: VIX elevated with no recovery signal, credit spreads widening rapidly, HYG/JNK actually crashing, USD surging uncontrollably, US Treasury liquidity impaired. This is 2008 territory. The rule here is clear: defend first. Reduce leverage, cut high-beta positions, hold cash. Do not buy the dip.
Scenario 5 - Excessive Greed: VIX persistently below 15 (complacency), Fear & Greed above 75, market making new highs while breadth deteriorates, retail investors using leverage. This is when you reduce aggression - trim positions that have run too far, sell covered calls, rotate to quality.
The Live Metrics Stack
The system continuously monitors six data streams:
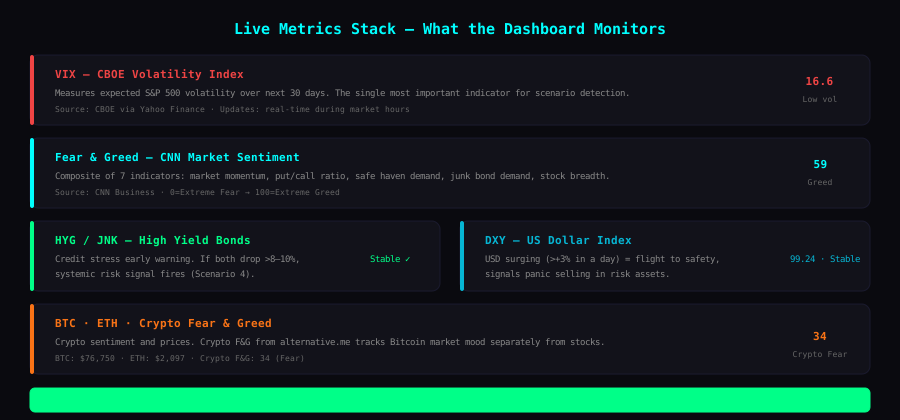
VIX (CBOE Volatility Index) is the primary scenario gate. Every scenario boundary is anchored to a VIX level. It's sourced from CBOE via Yahoo Finance and updates in real-time during market hours.
CNN Fear & Greed Index is a composite of seven market indicators - stock price momentum, put/call ratio, safe haven demand, junk bond demand, and market breadth. It provides a 0–100 sentiment score that cross-validates the VIX signal.
HYG and JNK (high-yield bond ETFs) are the systemic risk detectors. When both drop more than 8–10% from their highs, the credit market is under stress - a precondition for Scenario 4. The key distinction from a normal market pullback is that HYG/JNK should remain stable in Scenarios 1, 2, and 3.
DXY (US Dollar Index) is the panic detector. In a genuine flight-to-safety event, investors dump risk assets and buy dollars simultaneously, causing the USD to surge. A daily DXY move above +3% is a red flag for systemic conditions.
BTC and ETH with Crypto Fear & Greed provide a secondary sentiment layer. Crypto often amplifies the mood of broader risk markets and moves ahead of equities in both directions.
Portfolio Analysis with Context-Aware Advice
Beyond market classification, the dashboard lets you track individual stocks and receive advice that's calibrated to the current scenario:
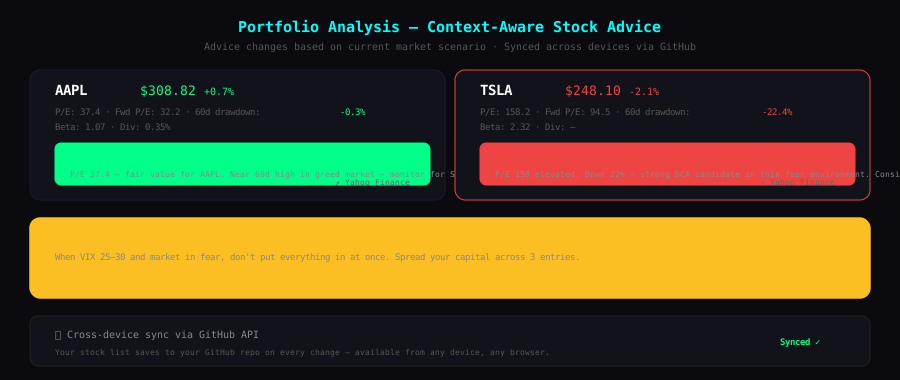
For each stock, the system fetches price, trailing P/E, forward P/E, beta, dividend yield, and 60-day drawdown - then generates advice that accounts for both the stock's own metrics and the market environment:
- A stock with P/E above 40 in a Scenario 5 (greed) market gets "consider trimming"
- The same stock down 22% from its high in a Scenario 2 (fear) market gets "strong DCA candidate - consider first tranche"
- In Scenario 4 (systemic risk), every stock gets "reduce position if leveraged - wait for credit to stabilize"
The portfolio list syncs across devices via GitHub API - your watchlist is stored as a JSON file in your private repo, so it's available from any browser on any machine.
Technical Architecture
The entire dashboard is a single static HTML file at /admin/stock.html - no Node.js server, no database, no build step.
Data flows through a Cloudflare Worker proxy (market-proxy.tongjixianing.workers.dev) that:
- Fetches Yahoo Finance v8 chart data with proper browser headers
- Acquires a Yahoo session crumb via
fc.yahoo.comto call thequoteSummaryAPI for P/E and fundamentals - Fetches CNN Fear & Greed with the correct
Refererheader - Fetches Crypto Fear & Greed from alternative.me
- Returns CORS-open JSON to the browser
All data is cached in memory for the session, with a configurable auto-refresh rate (10 minutes by default, adjustable from 30 seconds to 1 hour).
The page lives under /admin/ which is protected by the same Decap CMS GitHub OAuth flow - only someone authenticated with the GitHub account can access it.
Why Build This vs Use Existing Tools
There are plenty of market dashboards out there. The reason I built my own:
Everything in one view. Most tools show you VIX in one tab, Fear & Greed in another, your portfolio in a third. The value of this framework is that all signals are evaluated together to produce a single classification and action.
Framework enforcement. Having the decision logic codified means I can't talk myself into a Scenario 4 buy because "it feels like it's bottoming." The system reads the signals and tells me which scenario I'm in.
Private and cost-free. This runs on Vercel (free), Cloudflare Workers (free tier: 100K requests/day), and GitHub (free). There's no subscription, no API key fee, no data vendor.
Personalised portfolio context. Generic dashboards don't know my specific holdings. This one gives advice that's specific to what I own and calibrated to the current market regime.
The dashboard is private (admin-only, not publicly accessible). If you want access to the desktop app version with all features - portfolio tracker, P/E analysis, cross-device sync - it's available for purchase:
→ Buy Market Radar Desktop App - $20
After payment you'll receive a license key and download link for the Java desktop app (runs on Windows, Mac, Linux).